The block type “Diagram from Google Sheets” allows you to add different chart types to your site. The underlying data comes from a Google Sheet.
The necessary steps are:
- Add your data to a Google sheet
- Copy the “publish link” and extract the key
- Set your sharing preferences
- Use the key and the range in a diagram block at 9blox.com.
These steps will be described in detail below.
Add your data to a Google sheet
Create a Google sheet. You need a (free) Google account for that.
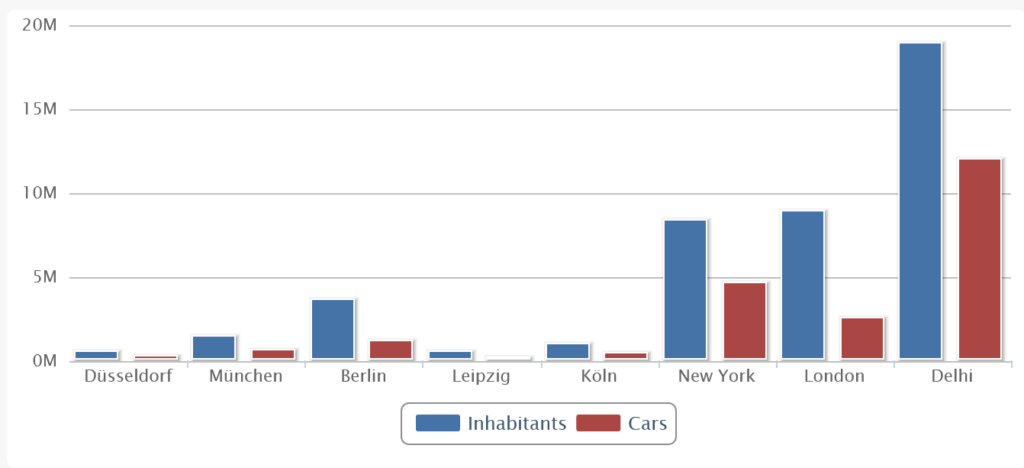
Enter your data as a table, e.g. like this:
| City | Inhabitants |
| Düsseldorf | 619000 |
| München | 1472000 |
| Berlin | 3645000 |
| Leipzig | 590000 |
Use as many rows as you like, and as many columns as you like, although for diagrams three columns are usually enough. For a pie chart, only two columns suffice.
The first row should contain the column headers.
Copy the “publish link” and extract the key
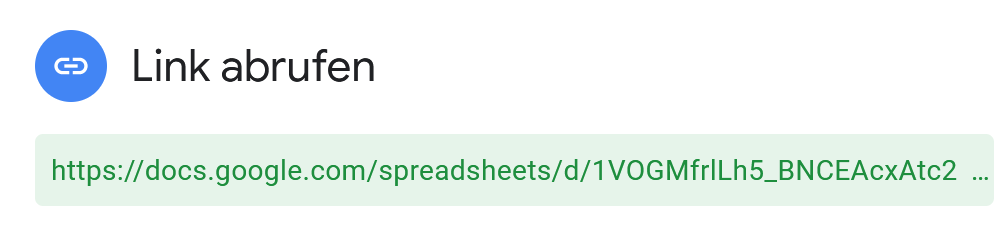
Copy the link of the sheet from the “Publish button”.
Here’s an example link: https://docs.google.com/spreadsheets/d/1VOGMfrlLh5_BNCEAcxAtc2QcAseNC904efsGde282RU/edit?usp=sharing
You have to extract the key, which is the part between the slashes- marked in bold above:
1VOGMfrlLh5_BNCEAcxAtc2QcAseNC904efsGde282RU
You will need this key at 9blox.com.
Then choose the range of the table data, e.g. A20:B24
Also note down the name of the sheet, e.g. “Sheet1“. The full reference is thus Sheet1!A20:B24.
If you want your chart to be publicly visible, you’ll have to change the sharing preferences.
Change your sharing preferences
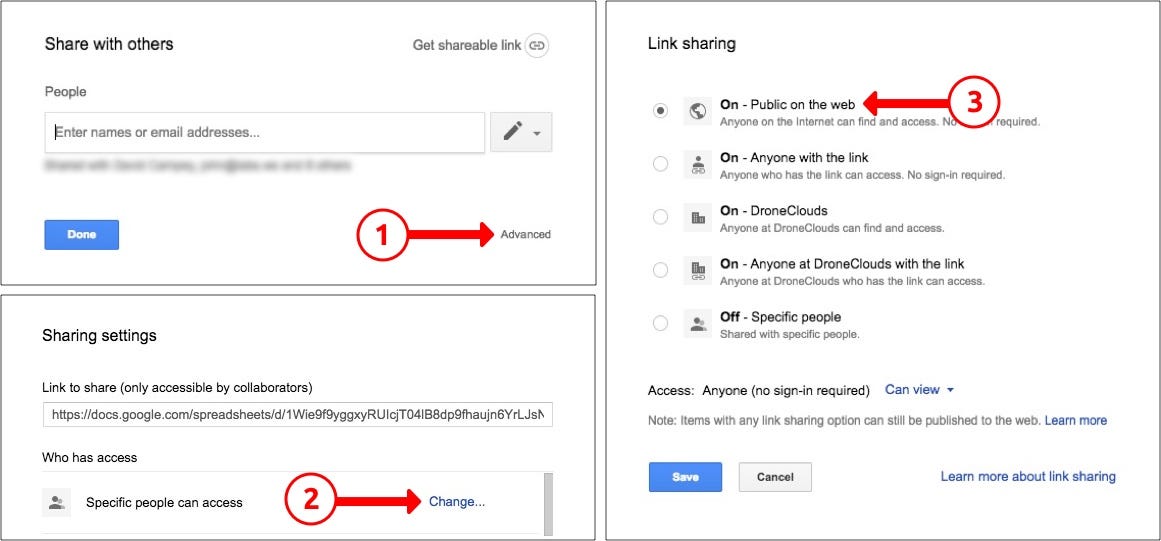
To change the sharing preferences, click on the Share button in the top right corner of Google Sheets.

In the pop-up modal, click on the “Advanced” link, then “Change” to set who will have access to your chart, and then “On — Public on the web” option to make it public.
If you cannot find that in your Google Sheets version, create a public link in the “Publish” dialog.
You also need to go to the File menu and “publish” the sheet to the web.
Use the key and the range in a diagram block

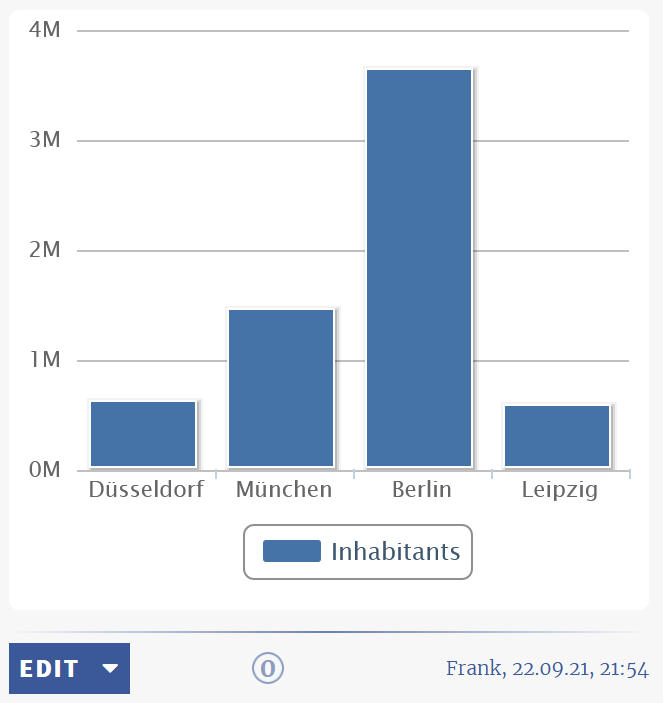
You now have a key and a range to add to your 9blox.com page. This will be displayed in a separate block and it will update when you change your data within Google Sheets. Choose the “Diagram from Google Sheets” block type and enter:
- A text you want to display at the top of the block (can be left empty)
- The key for your Google Sheet which you extracted above.
- The name of the sheet, an “!” and the range of the cells you want to display, e.g. “Sheet1!A20:B24”
- The number of columns you have, e.g. 2. This must fit to the range (e.g. range A20:B24 would mean 2 columns).
- The choice if you want to see the table, a diagram or both
- The choice of the diagram type (if you chose “diagram” or both just before)
Enter these values into the block and click on Save. That’s all. 9blox.com will display the diagram and also update itself automatically when the values in the Google sheet changes.
If your diagram is too wide, you can expand the block width (as with any block). Note, however, that this will not look good on a mobile.