This page provides additional information and examples to explain the usage of 9Blox.com.
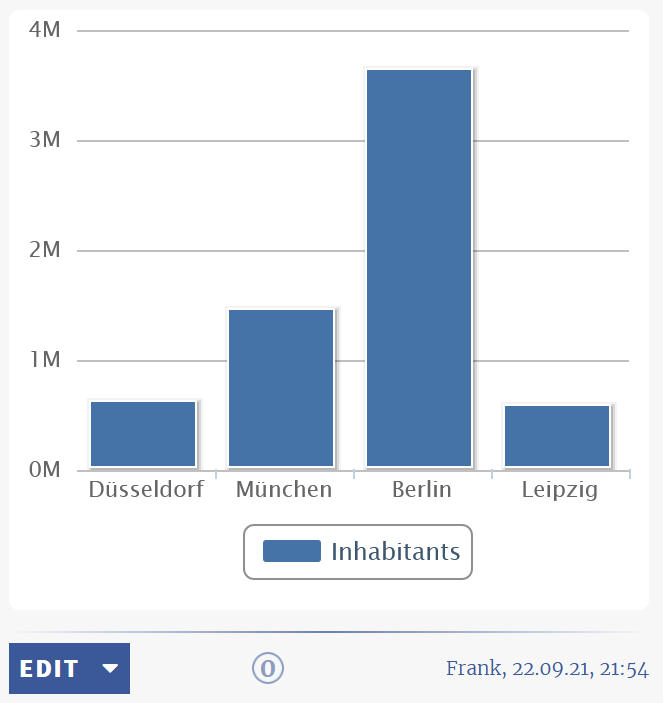
9Blox.com creates a simple web page. Everyone who knows a unique link can read and (if allowed) edit it. Create brainstorming texts, to do lists, a static page, surveys etc! No registration needed, totally anonymous! See an example.
Scroll through the articles below (or choose from the categeries above) to get some ideas and detailed instructions for building your own site.
Questions? Write a short mail to Frank Dux. Created April 2021.
The block type “Diagram from Google Sheets” allows you to add different chart types to your site. The underlying data comes from a Google Sheet.
The necessary steps are:
Add your data to a Google sheet
Copy the “publish link” and extract the key
Set your sharing preferences
Use the key and the range in a diagram block at 9blox.com.
These steps will be described in detail below.
Add your data to a Google sheet
Create a Google sheet. You need a (free) Google account for that.
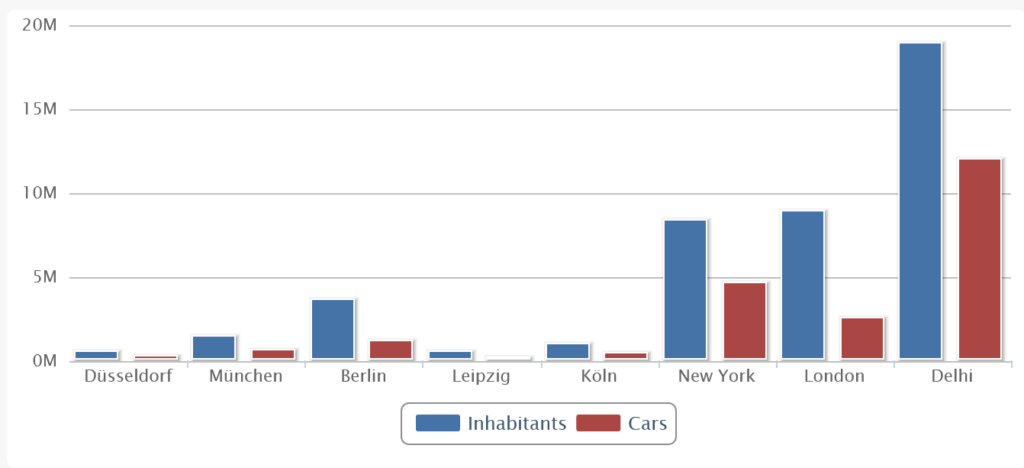
Enter your data as a table, e.g. like this:
City
Inhabitants
Düsseldorf
619000
München
1472000
Berlin
3645000
Leipzig
590000
Sample table
Use as many rows as you like, and as many columns as you like, although for diagrams three columns are usually enough. For a pie chart, only two columns suffice.
The first row should contain the column headers.
Copy the “publish link” and extract the key
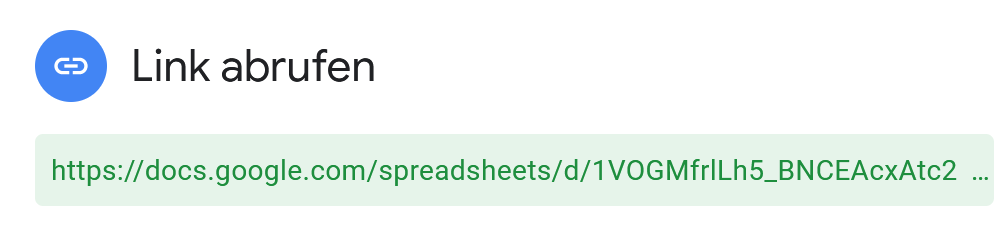
Copy the link of the sheet from the “Publish button”.
You have to extract the key, which is the part between the slashes- marked in bold above:
1VOGMfrlLh5_BNCEAcxAtc2QcAseNC904efsGde282RU
You will need this key at 9blox.com.
Then choose the range of the table data, e.g. A20:B24
Also note down the name of the sheet, e.g. “Sheet1“. The full reference is thus Sheet1!A20:B24.
If you want your chart to be publicly visible, you’ll have to change the sharing preferences.
Change your sharing preferences
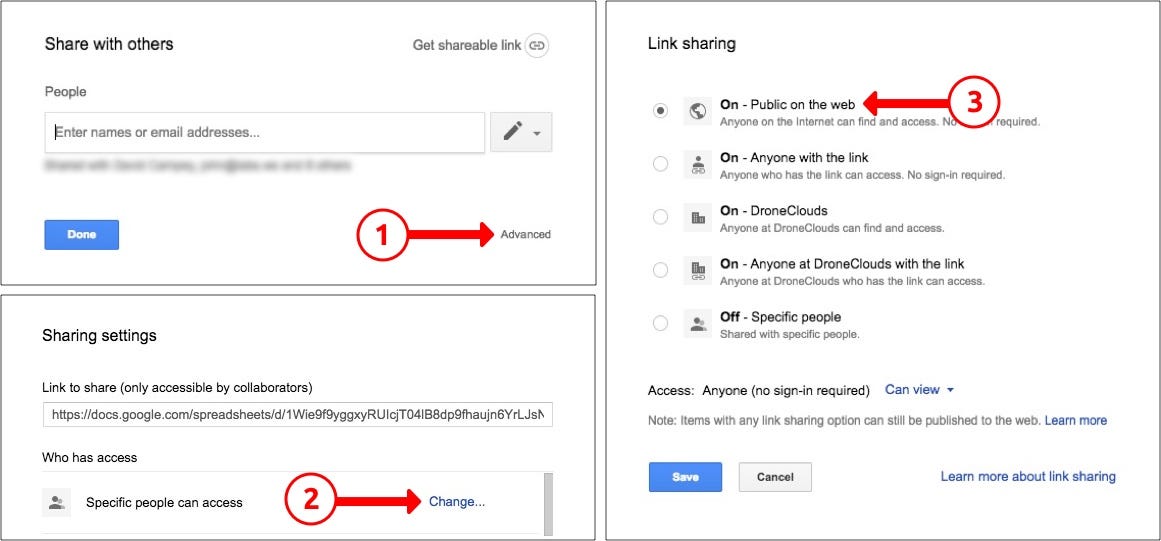
To change the sharing preferences, click on the Share button in the top right corner of Google Sheets.
Click on the Share button to change your sharing preferences
In the pop-up modal, click on the “Advanced” link, then “Change” to set who will have access to your chart, and then “On — Public on the web” option to make it public.
Change your sharing preferences accordingly
If you cannot find that in your Google Sheets version, create a public link in the “Publish” dialog.
You also need to go to the File menu and “publish” the sheet to the web.
Use the key and the range in a diagram block
You now have a key and a range to add to your 9blox.com page. This will be displayed in a separate block and it will update when you change your data within Google Sheets. Choose the “Diagram from Google Sheets” block type and enter:
A text you want to display at the top of the block (can be left empty)
The key for your Google Sheet which you extracted above.
The name of the sheet, an “!” and the range of the cells you want to display, e.g. “Sheet1!A20:B24”
The number of columns you have, e.g. 2. This must fit to the range (e.g. range A20:B24 would mean 2 columns).
The choice if you want to see the table, a diagram or both
The choice of the diagram type (if you chose “diagram” or both just before)
Enter these values into the block and click on Save. That’s all. 9blox.com will display the diagram and also update itself automatically when the values in the Google sheet changes.
If your diagram is too wide, you can expand the block width (as with any block). Note, however, that this will not look good on a mobile.
You can integrate content from your Dropbox account into a block. This is a bit difficult, but manageable. Let’s do it step by step.
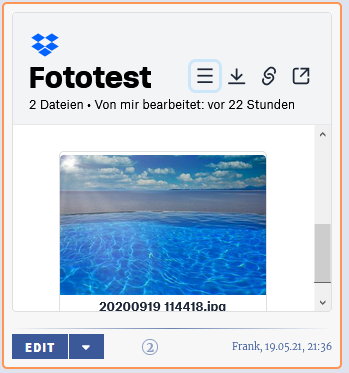
Log in to Dropbox and choose files
Log in to your Dropbox account and choose the file or folder you want to share. It’s best to put your files into a separate folder, e.g. the photos you want to share. On the right side of the screen you can share a file or folder; create the sharing link. It looks similar to this: https://www.dropbox.com/sh/b5x52plnsl738z1/AADKZ8NBNZfaj6Ikqnrxql8Ua?dl=0
Create an App
You need to create an “App” within Dropbox to allow access from other websites (such as 9blox.com). Go to the Drobox Embedder page at https://www.dropbox.com/developers/embedder
Ensure that you are logged in to Dropbox.
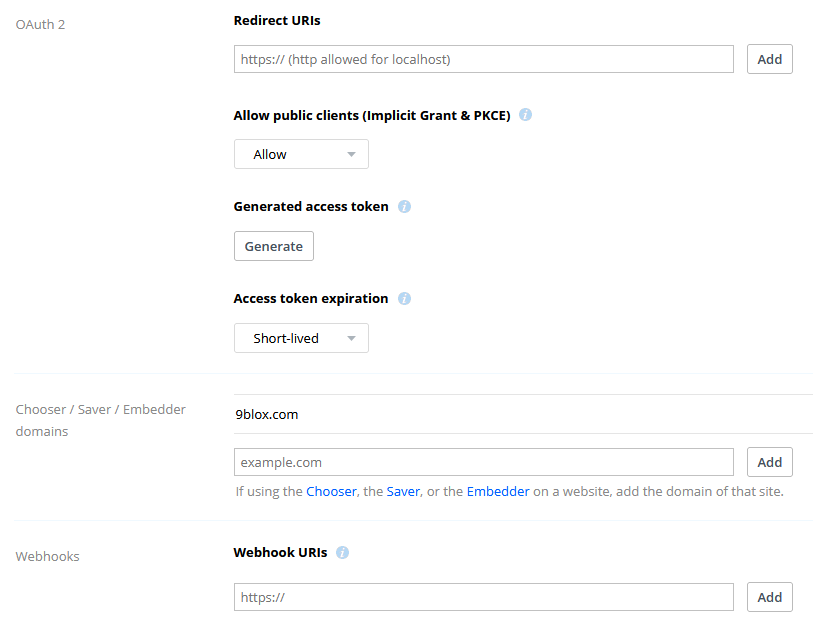
You need to click on Create new app. No fear now; you need only a few settings:
Choose the “Scoped access” API
Choose the “App folder” type of access
Give it any name
Enter “9blox.com” in the “Chooser / Saver / Embedder domains”
In the permissions tab, choose read access for account info and files.content.
The rest is irrelevant. Don’t forget to submit your changes on each tab
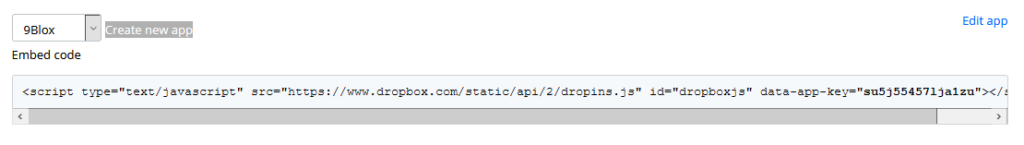
On the embedder page https://www.dropbox.com/developers/embedder you can now choose your new App from the dropdown box. There is a line of code (“embed code”) directly underneath it, already prefilled with your API key. Select it.
Now you have two lines of code:
the embed code from the App
the sharing link from the first step
Add a block to 9blox.com
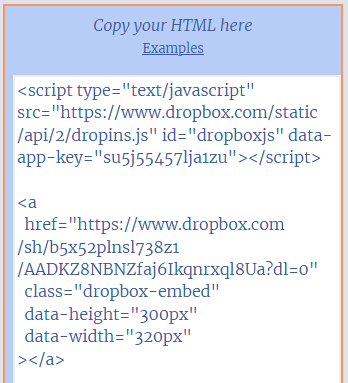
Go to your page at 9blox.com and add an iFrame/HTML block.
Paste your two lines in there: first the embed code, then the sharing link. It should look like this:
Adjust the “data-width” to “320px”, or to “100%” in case you want to use double width on that block. Click on “Save”. That’s it.
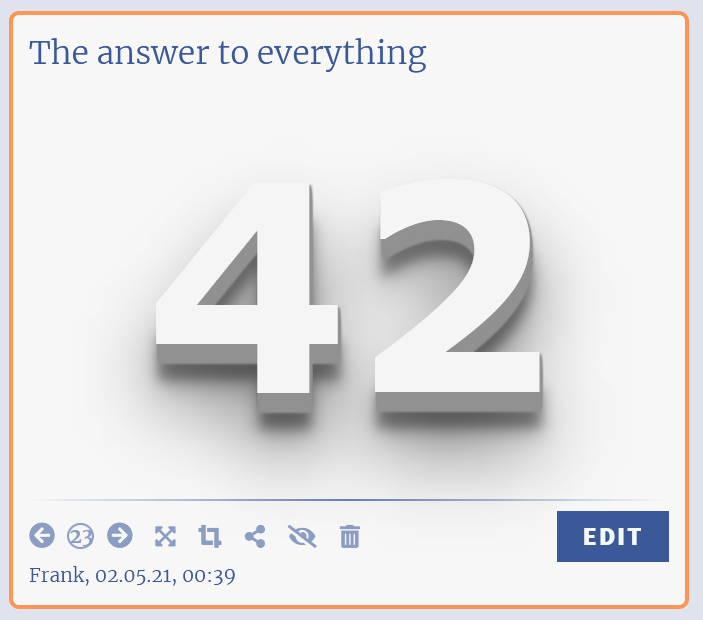
You can embed a value from a single cell from a Google Sheet into your page at 9blox.com, which will then be displayed prominently. This is the recipe:
Copy the “publish link” and extract the key
Set your sharing preferences
Use the key and the range in a number block at 9blox.com.
These steps will be described in detail below.
Copy the “publish link” and extract the key
In Google Sheets, go to the sheet/tab with the chart you want to share or embed and copy the the link from the “Publish button”.
This link will share the whole sheet but obviously you don’t want to do that; you want to share a specific cell. You have to extract the key, which is the part between the slashes – marked in bold above:
1VOGMfrlLh5_BNCEAcxAtc2QcAseNC904efsGde282RU
You will need this key at 9blox.com.
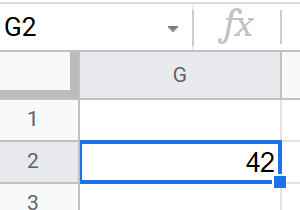
Also note down the name of the sheet and the ID of the cell you want to share, e.g. “Sheet1” and “G2”.
If you want your chart to be publicly visible, you’ll have to change the sharing preferences.
Change your sharing preferences
To change the sharing preferences, click on the Share button in the top right corner of Google Sheets.
Click on the Share button to change your sharing preferences
In the pop-up modal, click on the “Advanced” link, then “Change” to set who will have access to your chart, and then “On — Public on the web” option to make it public.
Change your sharing preferences accordingly
If you cannot find that in your Google Sheets version, create a public link in the “Publish” dialog.
You also need to go to the File menu and “publish” the sheet to the web.
Use the key and the range in a number block
You now have a key and a range to add to your 9blox.com page. This will be displayed in a separate block and it will update when you change your data within Google Sheets. Choose the “Number (Value from Drive)” block type and enter:
A text you want to display at the top of the block (can be left empty)
The key for your Google Sheet which you extracted above.
The name of the sheet, an “!” and the range of the cell you want to display, e.g. “Sheet1!G2”
Enter these values into the block and click on Save. That’s all. 9blox.com will display the value and also update itself automatically when the value in the Google sheet changes.
You can embed a diagram created in Google Sheets into your page at Textpage.net. Here’s how to share or embed a Google Sheets chart publicly and make it update instantly when you change data ranges:
Copy the url from the browser bar and change the url
Set your sharing preferences
Share or embed the url
These steps will be described in detail below.
Copy & change the link in the browser url bar
In Google Sheets, go to the sheet/tab with the chart you want to share or embed and copy the the link in the browser url bar.
This link will share the whole sheet but obviously you don’t want to do that; you want to share a specific chart.
Paste your link into a text editor where you can change it.
Replace the “edit#” part in the url with: htmlembed/sheet?
Next, get the cell number where your chart is and add it in the following format to the end of the url: &range=B8 If you don’t know what the cell number for your chart is, just cut and paste the chart in any cell. That will be the cell you’ll use. The chart mentioned above is at B8 as you can see.
If you want your chart to be publicly visible, you’ll have to change the sharing preferences.
Change your sharing preferences
To change the sharing preferences, click on the Share button in the top right corner of Google Sheets.
Click on the Share button to change your sharing preferences
In the pop-up modal, click on the “Advanced” link, then “Change” to set who will have access to your chart, and then “On — Public on the web” option to make it public.
Change your sharing preferences accordingly
If you cannot find that in your Google Sheets version, create a public link in the “Publish” dialog.
You also need to go to the File menu and “publish” the sheet to the web.
Share or embed the url
You now have a url you can share or embed in an iframe that will instantly update when you change your data ranges. Choose the “iFrame” block type and enter the following:
The width of the diagram will depend on the width of the diagram in your Google Sheet; you can resize the diagram there. Choose a size that fits into a textblock (about 340 Pixel). Stating 100% is most often correct.
The height should reflect the height of your diagram in Google; play around with different values to avoid scrollbars.
Then enter this piece of code into the text block and click on Save. That’s all.
You can add a block which displays the upcoming events (for the next month) of a public Google calendar. Use this for example to display upcoming events, availabilities of a venue or for similar ideas.
Get the calendar ID from your Google calendar
First of all, you need a Google account. If you do not have one already, create it here. Then you need a calendar. You may want to create a separate (new) calendar for sharing (and not use your own private Google calendar)
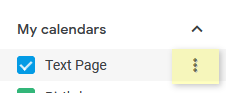
Open your Google calendar. Then go to the calendar list on the left side and choose the options (via the three vertical dots) of your calendar (in this example called “Text Page”).
Click on the three dots and choose “Settings and sharing”
The calendar settings will be displayed.
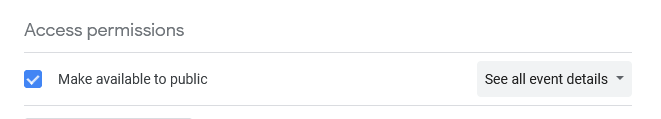
You need to set your calendar to public. Careful: This means that everyone who knows the link to your public calendar can see all events and all event details!
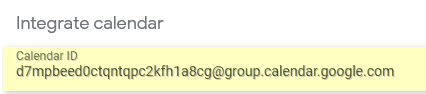
Then scroll down and copy the calendar ID.
Embed your calendar to 9Blox.com
In your page at 9Blox.com, add a new block of type “calendar integration block”.
Then add the public Google calendar’s ID, e.g. 9epnpsbc5bs39lr5bt1uecpbds@group.calendar.google.com
Click on “Save”. Your page at 9Blox.com will extract the data from your public calendar and display all upcoming events (up to one month ahead from today).
If you want to stop sharing, either remove that block at 9Blox.com or set your calendar in Google to “private”.
Create appointments
Enter your Google account; there enter your calender. Create a new appointment; the headline (title of the appointment), date, location and description will show up in your 9Blox.com page. Ensure that you add your appointments to the correct (public) calendar in Google when you have more than one calendar! Typically different calendars use different colours.